

TLDR
- Methane is a powerful greenhouse gas with an outsized impact on global warming
- Tracking methane emissions faces a number of challenges but mitigation is essential to keep below 2.0c
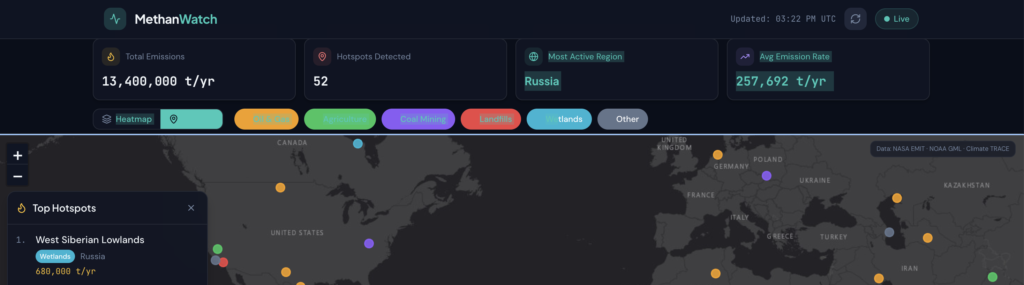
- MethanWatch is an interactive global map that updates with realtime methane emission data from the NOAA Global Monitoring Laboratory
- Key stats and data can easily be viewed, allowing the user to understand location, scale and source
Overview
- Methane is responsible for roughly 30% of global warming since the Industrial Revolution and is the second-largest driver of climate change after carbon dioxide
- It has an outsized negative impact, it traps 80 to 86 times more heat than carbon dioxide over a 20-year timeframe
- Carbon Dioxide gets the most attention and has most innovation towards reduction, however because of its short lifespan (12 years), cutting methane emissions would quickly lower atmospheric concentrations and slow near-term global warming faster than cutting CO₂ alone (source)
- Roughly 30% of methane released is from natural sources (source), adding a layer of complexity to the tracking and management of atmospheric methane
Problem
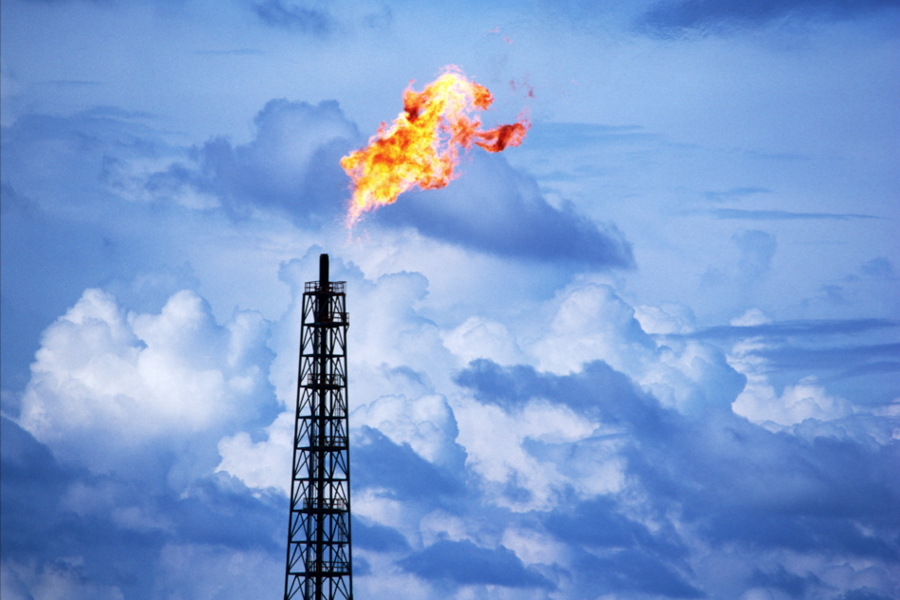
Despite the potential to make a positive impact reducing the affects of climate change, methane emission reduction faces a number of challenges:
- Measurement uncertainty
- Dispersed sources
- Legacy infrastructure
- Regulatory gaps
- Data and verification challenges
- Source
Solution
Using AI, I created MethanWatch, an interactive global map highlighting methane hotspots and sources.
This tool allows anyone to understand where methane is coming from and what the sources are. Methane volume has been added to help understand the scale of the issue and prioritize where mitigation strategies may be implemented.
Link: MethanWatch
Technical Information
How it works
- A full-screen world map plots 52 major emission sites across 6 continents, sized and colored by estimated annual emissions
- The global trend comes from NOAA, is stored on the server for 60 minutes, and is served to the dashboard from there
- The dashboard reloads its data on its own:
- Hotspots and summary stats every 5 minutes
- The trend chart every 10 minutes
- Summary figures (total estimated emissions, number of hotspots, country with the highest total) are calculated on the server from the hotspot data.
Data sources
- NOAA Global Monitoring Laboratory: monthly global average methane levels in the atmosphere (ppb), from 1983 to the present. This feed updates automatically.
- Curated hotspot dataset: 52 real oil and gas fields, coal basins, farming regions, landfills and wetlands, each with coordinates, country, region, source type, estimated emission rate and a short description.
Map views
- Heatmap mode: circles grow and get more solid as emissions rise, on a color scale from green (under 10k t/yr) to red (over 200k t/yr).
- Marker mode: each site is a dot colored by source type.
- Clicking any site opens a popup with its name, type, emissions, country, region, detection date and description.